Analysis of Restaurants based in Bengaluru
Introduction
Below are the images of the graphs which I plotted of the restaurant Dataset. There are other images as well, where I had anayzed the affects of different features like rating, restaurant types, cuisines etcera over location. I felt it was repetative and unrequired. Hence I did not include in the display here.
Top expensive Restaurants
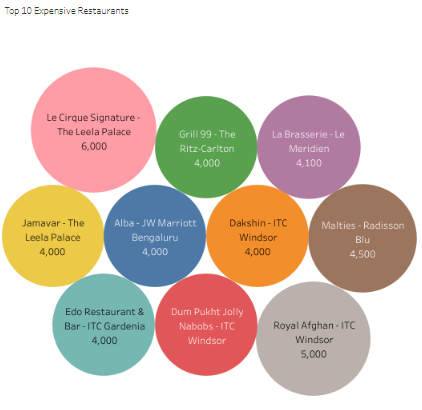
The graph shows the top 10 expensive restaurants across the city.
Here are some of the interesting findings from the graph:
- A franchisie of Le Cirque Signature at The Leela Palace in New Delhi, India, is the most expensive restaurant on the list, with an average price of ₹6,000 per person.
- The next two most expensive restaurants are both a Franchisie of restaurants in Hong Kong: Grid 99-The Ritz-Carlton at HK$4,000 per person and La Brasserie-Le Meridien at HK$4,100 per person.
- The remaining seven restaurants on the list are all in India: Jamavar-The Leela Palace in Bengaluru (₹4,000 per person), Alba-JW Marriott Bengaluru (₹4,000 per person), Dakshin-ITC Windsor in Chennai (₹4,000 per person), Malties Radisson Blu in Bengaluru (₹4,500 per person), Edo Restaurant & Bar-ITC Gardenia in Bengaluru (₹4,000 per person), Dum Pukht Jolly Nabobs ITC Windsor in Chennai (₹5,000 per person), and Royal Afghan-ITC Windsor in Chennai (price unavailable).
- It is important to note that these prices are just averages, and the actual cost of dining at any of these restaurants can vary depending on a number of factors, such as the menu items you order and the type of wine or liquor you drink. Additionally, these prices may not include taxes or gratuity
Highly Voted Restaurants
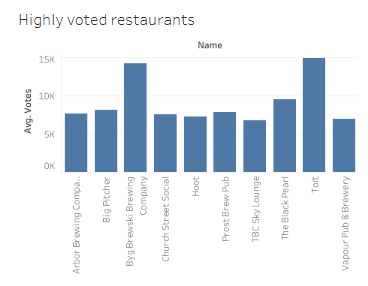
The bar graph showing the highest voted restaurants in Bengaluru. It is based on user reviews
on
Zomato
Here are some of the interesting findings from the graph:
- The y-axis shows the average Zomato rating, with scores ranging from 4.4 to 4.8
- The x-axis shows the names of the restaurants.
- The most popular restaurant, based on average rating, is Arbor Brewing Company, with a score of 4.8
- The other restaurants on the list have average ratings between 4.4 and 4.7
It's important to note that this graph only shows a small sample of the many restaurants in
Bengaluru,
and it doesn't take into account factors like price range, cuisine, or ambiance.
Additionally,
user
reviews can be subjective, so it's always a good idea to do your own research before
deciding
where
to
eat.
If you're looking for more information about any of the restaurants on this list, I
recommend
searching
for them online or on Zomato itself. You can also read user reviews to get a sense of what
other
diners
thought of their experience.
Top Dishes Liked by Users
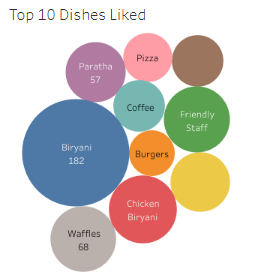
The graph shows It shows the top 10 most popular dishes
Here are the top 10 dishes, along with the number of votes or likes they received:
- Paratha - 57
- Biryani - 182
- Pizza - 57
- Waffles - 68
- Coffee - not ranked
- Friendly Staff - not ranked
- Burgers - not ranked
- Chicken Biryani - not ranked
It is important to note that this graph does not tell us anything about the origin of these
dishes,
or
the restaurants that serve them. It also does not take into account the price range or
nutritional
value
of these dishes.
If you are interested in learning more about any of the dishes on this list, I would
recommend
doing
some additional research online or asking a food expert.
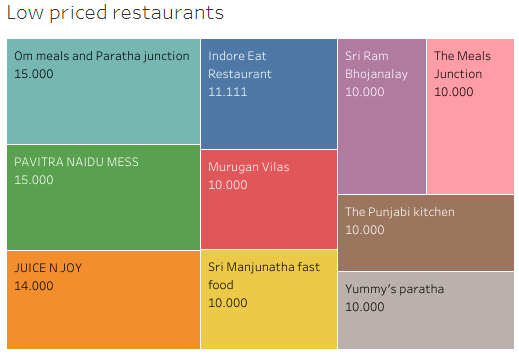
Low Priced Restaurants
| Restaurant Name | Estimated Price per person |
|---|---|
| Om Meals and Paratha Junction | ₹10,000 |
| Sri Ram Bhojanalay | ₹10,000 |
| Pavitra Naidu Mess | ₹15,000 |
| Murugan Vilas | ₹10,000 |
| The Punjabi Kitchen | ₹10,000 |
| Juice N Joy | ₹14,000 |
| Sri Manjunatha Fast Food | ₹10,000 |
| Yummy's Paratha | ₹10,000 |
Please note that the price listed is likely an estimate and may vary depending on the items that user order's. If you have any specific questions about these restaurants or their prices, I recommend contacting them directly.
Top Restaurant Types
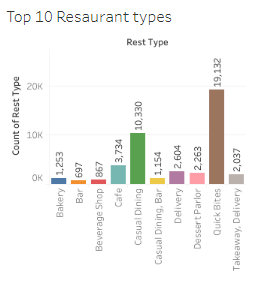
The graph is showing the top 10 restaurant types in the Benagluru, based on the number of establishments:
- The most popular restaurant type in the United States is "Quick Bites", with over 19,132 establishments. This category likely encompasses a wide variety of fast-food and grab-and-go options, such as sandwich shops, salad bars, and cafes with quick service.
- Casual Dining establishments come in at a close second, with 10,330 restaurants. This category likely includes sit-down restaurants with table service offering a wider selection of dishes than Quick Bites options.
- Rounding out the top three is "Cafes" with 3,734 establishments. Cafes typically offer coffee, tea, and other beverages alongside light meals and pastries.
- Other well-represented categories include:
- Bakeries (1,253)
- Delivery (2,604)
- Dessert Parlors (2,263)
- Bars (697)
- Beverage Shops (867)
- Takeaway & Delivery (2,037)
- Casual Dining, Bar (1,154)
It's important to note that this graph only shows the number of establishments, not
necessarily
the
popularity or revenue of each type. For example, while there are many Quick Bites
restaurants,
they
may
have lower average revenue per customer than Casual Dining establishments.
Overall, the graph provides a snapshot of the diverse restaurant landscape in the United
States,
with a
clear preference for quick and convenient dining options
Top Bestseller Cuisines
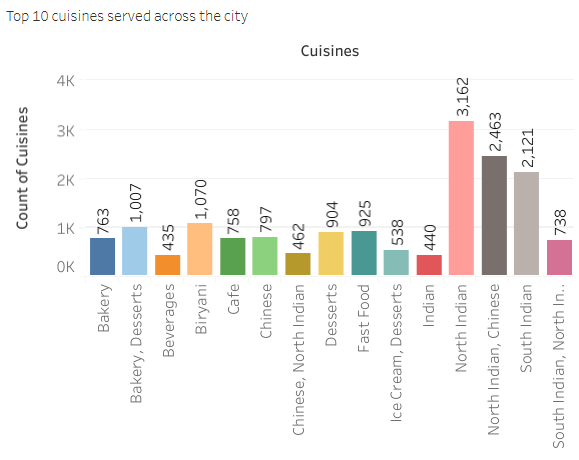
The graph shows the top 10 cuisines served across the city. The most popular cuisine is North
Indian,
followed by North Indian and Chinese, South Indian, Chinese, Biryani, Bakery, Bakery and
Desserts,
Desserts, and Fast Food.
Here are some of the interesting findings from the graph:
- North Indian cuisine is the most popular, followed by a mix of other cuisines. This suggests that people in the city enjoy a variety of flavors, but North Indian food is still the most popular.
- There is a lot of overlap between different cuisines. For example, there are many restaurants that serve both North Indian and Chinese food. This suggests that people are open to trying different flavor combinations.
- Desserts are popular. There are four different dessert categories in the top 10. This suggests that people in the city have a sweet tooth.
- It is important to note that this graph is based on the number of restaurants serving each cuisine, not the number of people who eat each cuisine. So, it is possible that some cuisines are more popular than others, even though they have fewer restaurants.
Highly Rated restaurant
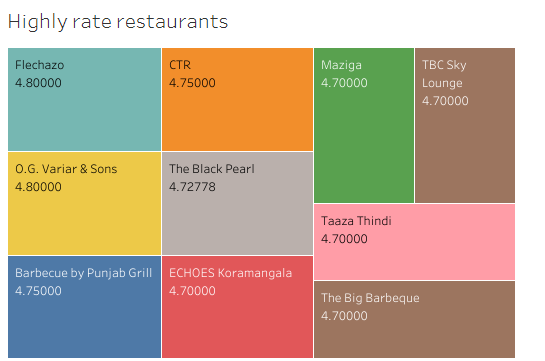
The above graph is a list of the top 10 highly-rated restaurants in Bengaluru, based on Zomato user ratings.
Here's what I analysed
- The restaurants are ranked by their average Zomato rating, displayed on a scale of 4.4 to 4.8.
- The highest-rated restaurant is Flechazo, with an average rating of 4.80.
- The other restaurants on the list have average ratings between 4.70 and 4.75.
- The list includes a variety of cuisines, including Mediterranean, Japanese, Chinese, and Indian.
- Here are some additional details of the graph:
| Restaurant Name | Cuisine | Zomato Rating |
|---|---|---|
| Flechazo | Mediterranean | 4.80 |
| CTR - Central Tibetan Restaurant | Tibetan | 4.75 |
| Maziga | Japanese | 4.75 |
| TBC Sky | Continental & European | 4.70 |
| O.G. Variar & Sons | Chettinad | 4.70 |
| The Black Pearl | Seafood | 4.70 |
| Taaza Thindi | North Indian | 4.70 |
| Barbecue by Punjab Grill | Punjabi | 4.70 |
| ECHOES Koramangala | Casual Dining | 4.70 |
| The Big Barbeque | Barbeque | 4.70 |
It is important to note that this list only represents a small sample of the many great restaurants in Bengaluru, and it is based on user reviews on Zomato, which may not be entirely objective. If you are looking for a restaurant in Bengaluru, I recommend doing your own research and reading reviews from a variety of sources before making a decision.
Restaurants with Reservation facility
The graph shows the number of restaurants in Bangalore that offer online reservations,
categorized by
various cuisines.
Here's a breakdown of the information of the graph
Cuisines with the highest number of restaurants offering online reservations:
| Cuisine | Number of Restaurants with Online Reservation |
|---|---|
| North Indian | 5,565 |
| South Indian | 3,419 |
| Chinese | 1,961 |
| Bakery | 890 |
| Desserts | 582 |
Cuisines with the lowest number of restaurants offering online reservations:
| Cuisine | Number of Restaurants with Online Ordering |
|---|---|
| Rolls | 86 |
| Momos | 74 |
| Biryani | 63 |
| Shakes & Smoothies | 59 |
| Street Food | 54 |
Overall trends:
- A significant majority of restaurants in Bangalore offer online reservations, with some exceptions in niche categories like street food and momos
- North Indian cuisine has the most restaurants with online reservations, followed by South Indian and Chinese cuisine.
- Dessert and bakery restaurants also have a high adoption rate of online reservations.
- Market penetration: A significant portion of the restaurant industry in Bangalore has adopted online reservation systems, with almost 56,000 restaurants offering this convenience. This suggests a high level of digitalization and customer focus within the industry.
- Demand for convenience: The widespread adoption of online reservations indicates a strong demand from customers for a convenient and efficient way to book their dining experiences. This highlights the importance of offering online booking options for restaurants to remain competitive.
- Desserts are popular. There are four different dessert categories in the top 10. This suggests that people in the city have a sweet tooth.
- Variations across cuisines: While the overall adoption rate is high, some cuisines still show lower numbers. This could be due to various factors, such as the target audience, type of dining experience, or the prevalence of traditional walk-in culture within specific cuisines.
Restaurants with Online Order Facility
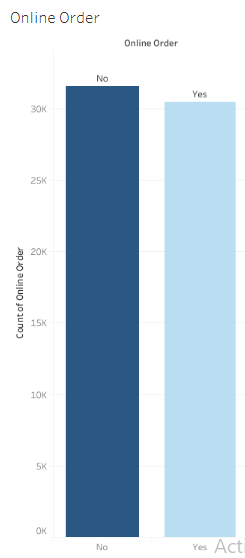
It shows the distribution of restaurants on Zomato based on whether they offer online ordering.
- The x-axis represents the availability of online ordering: It has two categories, "Yes" and "No".
- The y-axis represents the number of restaurants: The scale starts at 0 and goes up to 35,000 with increments of 5,000.
- There are two bars:
- The blue bar on the left represents restaurants that do not offer online ordering. Its height reaches around 20,000, indicating that there are approximately 20,000 restaurants on Zomato that don't have online ordering available.
- The green bar on the right represents restaurants that do offer online ordering. Its height reaches around 30,000, indicating that there are approximately 30,000 restaurants on Zomato that have online ordering available.
Key takeaways:
- More restaurants on Zomato offer online ordering than those that don't. This suggests that online ordering is becoming increasingly popular and convenient for both restaurants and customers.
- There is still a significant number of restaurants that don't offer online ordering. This could be due to various reasons, such as the type of cuisine, target audience, or lack of resources.
- the specific percentage of restaurants offering online ordering:
- Restaurants with online ordering: 30,444
- Restaurants without online ordering: 31,570
- Total restaurants: 62,014
- Percentage of restaurants with online ordering: (30,444 / 62,014) * 100 ≈ 49.1%