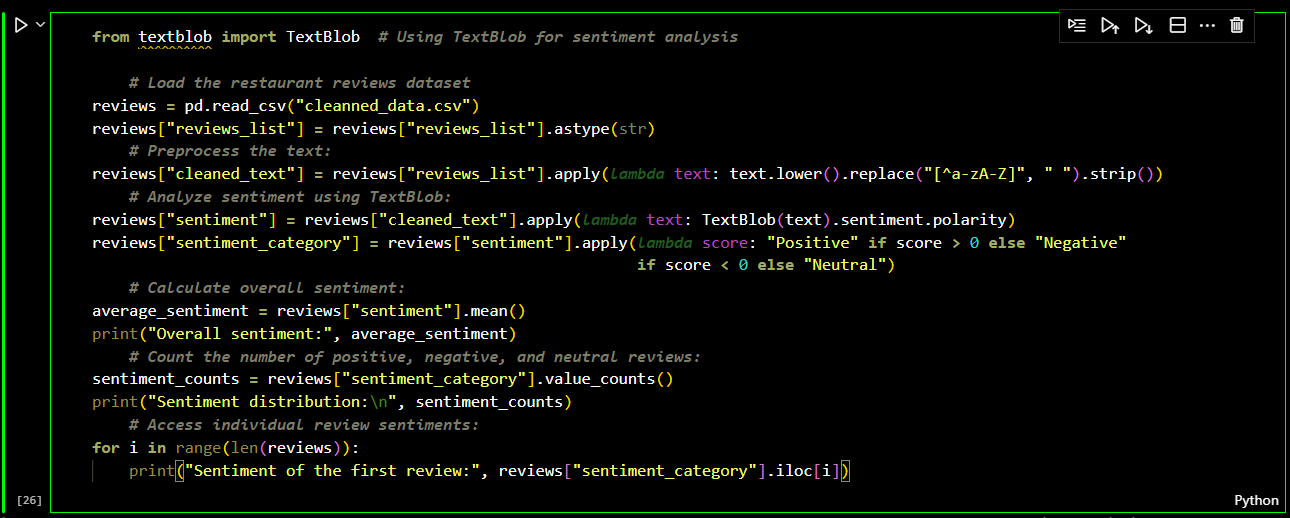
In order to find the sentiments of the reviews column in my Restaurant Dataset, I used the following function.
Later I plotted the graphs and did the sentiment analysis. You can check the following sections below.
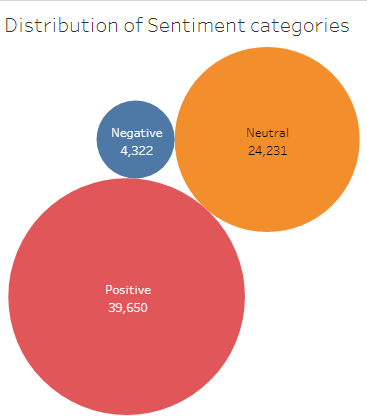
Sentiment Distribution
The above image shows the distribution of customer reviews for a restaurant across three
categories: positive, negative, and neutral. Here's a breakdown of the information it presents:
These are the most frequent type of review, accounting for
39,650 reviews, or 69.5% of the total.
These are the second most frequent type, with 24,231 reviews, or
42.8% of the total.
These are the least frequent type, with 4,322 reviews, or 7.7%
of the total.
Key Observations:
The vast majority of customers expressed positive sentiment in their reviews, with nearly 70%
falling into this category.
Neutral reviews are still quite common, suggesting that many customers had an average experience
that didn't leave a strong positive or negative impression.
Negative reviews are the least frequent, but they still represent a notable portion of the
feedback. It's important for the restaurant to consider these reviews and address any underlying
issues.
Summing up the positive, neutral, and negative reviews (39,650 + 24,231 + 4,322 = 68,203) allows
us to calculate the exact percentages for each category:
These updated percentages provide a more precise picture of the review distribution.
While the overall trend remains the same (positive reviews being the most frequent), the
exact proportions differ slightly from my initial estimates.
Top positively rated restaurants
The above bar chart shows the restaurants with positive reviews by customers.
Restaurant
Positive Reviews
Coal Grill & Cafe
1.000
Kerala Mess
0.877
Bombay Kulfi
0.841
Fresh Code
0.299
Fish Chain
0.294
Aashirvaa Restaurant
0.222
Bombay Bread & Butter
0.213
Delhite Food Corner
0.194
Guntur Restaurant
0.187
Kolkata Famous Restaurant
0.184
Key Takeaways
Coal Grill & Cafe has the highest number of positive reviews, with a score of 1.000. This could
indicate
that a large percentage of their customers leave positive feedback.
Kerala Mess and Bombay Kulfi also have very high positive review scores, exceeding 0.8.
The remaining restaurants on the list have positive review scores below 0.5, but they still rank
among
the top 10 in terms of positive reviews.
It's important to note that the meaning of the positive review scores and the specific criteria
used to
calculate them might vary depending on the reviewing platform or source.
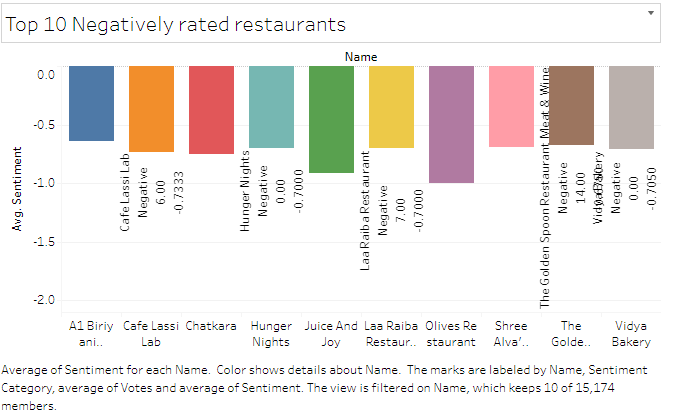
Top 10 Negatively rated restaurants
The above picture shows The restaurants with low sentiment level.
It ranges from 0 all the way to negative 1
Restaurants
Average Voting
Sentiment Score
A1 Biriyani Point
10
-0.6318
Cafe Lassi Lab
6
-0.733
Chatkara
0
-0.7475
Hunger Nights
0
-0.7
Juice and Joy
0
-0.9
LaaRaib a Restaurant
7
-0.7
Olive's Restaurant
0
-1
Shree Alva's Delicay
0
-0.6875
The Golden Spoon restaurant
14
-0.67
Vidya
0
-0.705
This table displays information about 10 restaurants, based on online reviews given by users and
customer
feedback.
This column shows the average rating or score given to each restaurant, on a
scale of 0 to 5. Interestingly, four restaurants have an average voting score of 0.
This column displays a sentiment score for each restaurant, calculated based on
the analysis of customer reviews. Negative scores indicate negative sentiment, with -1 being the
most
negative. The most negative sentiment score in the table is -1, belonging to Olive's Restaurant.
Some key observations from the table:
There is a large discrepancy between the average voting score and the sentiment score for some
restaurants. A1 Biriyani Point has a high average voting score of 10 but a negative
sentiment score of -0.6318.
Four restaurants have an average voting score of 0, but their sentiment scores vary. This
suggests
that
these restaurants may have received few reviews or mixed reviews with both positive and negative
sentiments.
Overall, this table provides a quick overview of the average voting and sentiment scores for 10
restaurants.
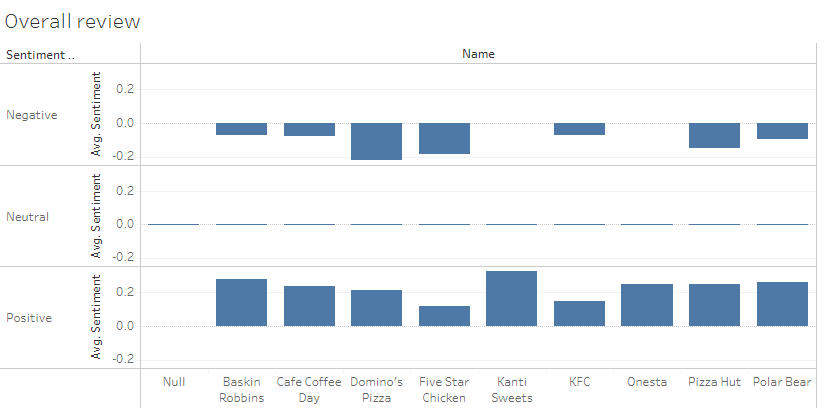
Overall reviews of Few Common Restaurants
Restaurants
Total positive sentiment Score
Total Negative sentiment score
Total Neutral score
Baskin Robin's
0.2749
-0.0736
0
Cafe Coffee Day
0.2370
-0.0769
0
Domino's Pizza
0.2122
-0.224
0
Five Star Chicken
0.1204
-0.1858
0
Kanti's Sweets
0.3270
None
0
KFC
0.1467
-0.0709
0
Onesta
None
2496
0
Pizza Hut
0.2465
-0.1493
0
Polar Bear
0.2625
-0.0982
0
This table shows the overall sentiment analysis of nine common restaurants,is based on customer
reviews, online mentions. It includes four columns:
This column lists the names of the restaurants.
This column displays a score representing the
overall
positive sentiment associated with each restaurant. Higher scores indicate more positive
sentiment.
This column shows a score representing the
overall
negative sentiment
associated with each restaurant. Lower scores indicate less negative sentiment.
This column displays a score representing the overall
neutral
sentiment associated
with each restaurant. Interestingly, all restaurants have a score of 0 in this column.
Key Observations:
Stands out with the highest positive sentiment score (0.3270) and
no
negative sentiment
score.
Has the highest negative sentiment score (2496) and no positive sentiment
score. This suggests a
significant amount of negative sentiment associated with the restaurant.
Several restaurants have similar sentiment scores: KFC, Domino's, Baskin Robin's, Cafe Coffee
Day,
Pizza Hut, and Polar
Bear have comparable positive and negative sentiment scores.
With a positive sentiment score of 0.3270 (close to the maximum
of
+1), it suggests a
very positive reception from users based on reviews, ratings, and votes
The high negative sentiment score of 2496 (assuming the range goes from
-1 to
+1) indicates
significant negative feedback. Investigating the reasons behind this negativity could be crucial
for
improvement.
Similar scores: Restaurants like Baskin Robin's and Pizza Hut having similar sentiment scores
suggest
comparable user perception in terms of positivity and negativity.
Supporting Files
The raw dataset files, the Jupyter Notebooks which I worked on to clean, analyze and create the models of the
data are found on my
github ripository. Please Click on Supporting files